Data Table
Below are the examples of the raw data collected. The ground cover data was measured at each quadrat along a 50 m transect in each site, ground cover species density indicated the average number of ground cover species per meter each site. The tree density and shrub density data were measured along the 50 m*1 m transect in each site, showing the average number of tree and shrub species per meter each site. The larger dataset contain 11 sites, 4 kinds of land types, ground cover species richness of 65, tree richness of 5, and shrub richness of 20. The sampling units for this study were 50 m*1 m belt transect. The predictor variable site number and quadrat were manipulated, while land type was observed and categorical. The response variables were the percentage cover of each ground cover species found in each quadrat, the total ground cover species density in each site calculated, tree and shrub density along the transect, basal area in each site.

Table 1. Example of ground cover sample data. Included information of site number, land use type, quadrat number, total ground cover species density, each ground cover species cover in quadrat. The larger dataset contains the complete ground cover species cover data.
|

Table 2. Example of tree density and shrub density sample data. Included information of site number, land use type, quadrat number, total tree density, each tree species density, basal area, total shrub density, each shrub species density. The larger dataset contains the complete tree and shrub species density data.
|
Exploratory graphics
Vegetation Richness
In order to evaluate vegetation diversity to decide sites that are most worthy of protection within ecosystem, vegetation richness and vegetation density were assessed separately.
First, we took a look at the variation between and within each land type. About the boxplot of ground cover species richness in each site, at each site, five quadrats were placed along the transect to measure the richness and percent cover of ground cover species. The spread of the data was quite high, with almost all data showing a high degree of variation and skew, only data of site 2, site 5, site 8, site 11 showed relatively low spread. Among them, site 6 showed the highest degree of spread. while site 9 showed the lowest. Also, there was outlier data in site 1, site 4, and site 9. About the boxplot of vegetation (tree, understory, and ground cover) richness in each land type, it is clear that natural boreal forest had the most vegetation richness, and almost all ecosystems had normal data.
First, we took a look at the variation between and within each land type. About the boxplot of ground cover species richness in each site, at each site, five quadrats were placed along the transect to measure the richness and percent cover of ground cover species. The spread of the data was quite high, with almost all data showing a high degree of variation and skew, only data of site 2, site 5, site 8, site 11 showed relatively low spread. Among them, site 6 showed the highest degree of spread. while site 9 showed the lowest. Also, there was outlier data in site 1, site 4, and site 9. About the boxplot of vegetation (tree, understory, and ground cover) richness in each land type, it is clear that natural boreal forest had the most vegetation richness, and almost all ecosystems had normal data.

Figure 9. Boxplot of ground cover richness in each site
|

Figure 10. Boxplot of vegetation (tree, understory, and ground cover) richness in each land type
|
Vegetation Density
Then, we assessed at the vegetation density in each ecosystem. The vegetation density and species type were relatively low in cropland and grassland. In cropland, site 2 and site 5 had marginally higher vegetation density than other sites. In grassland, the vegetation density in site 6 was four times than that in site 9. The vegetation density and species type were relatively high in aspen parkland and natural boreal forest. In aspen parkland, site3 had a slight advantage in vegetation density. In natural boreal forest, the vegetation density in the two sites was almost the same.

Figure 11. Barplot of tree, understory, and ground cover density (#/m2) by site in aspen parkland
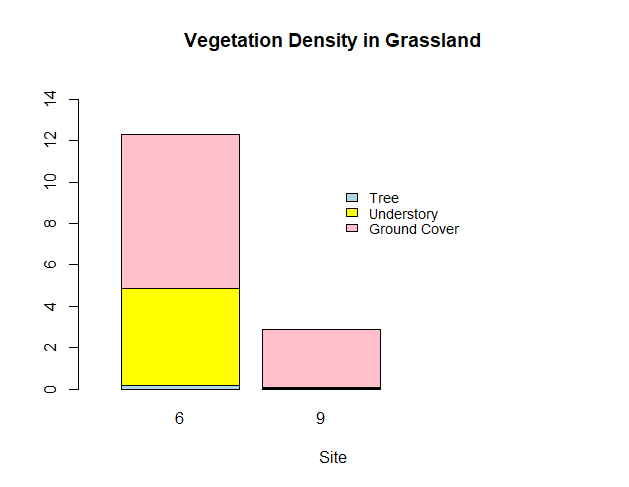
Figure 13. Barplot of tree, understory, and ground cover density (#/m2) by site in grassland
|
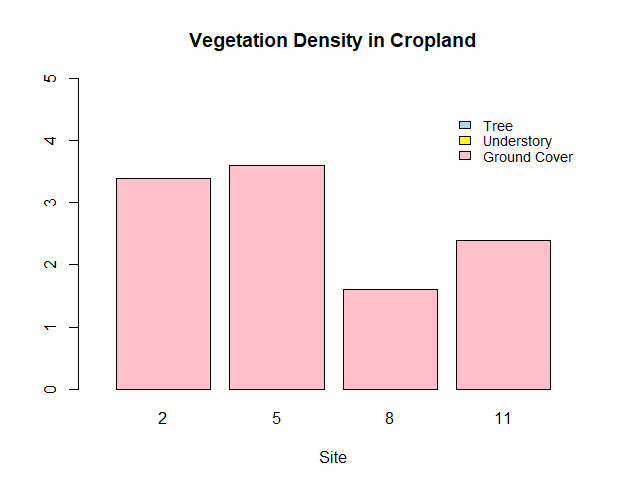
Figure 12. Barplot of tree, understory, and ground cover density (#/m2) by site in cropland
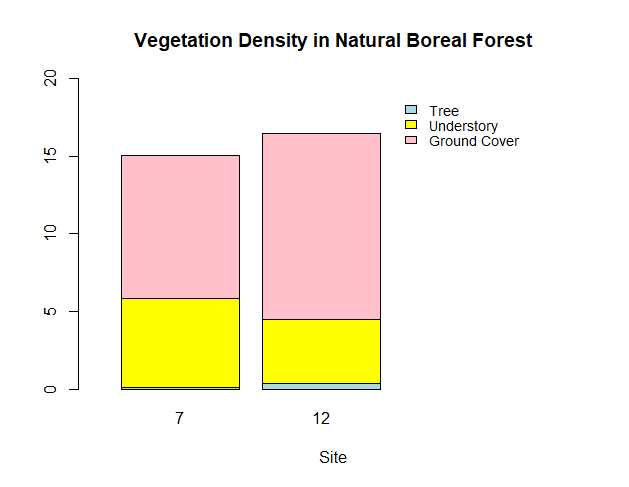
Figure 14. Barplot of tree, understory, and ground cover density (#/m2) by site in natural boreal forest
|
