Study Area
Métis Crossing is a culturally significant site located along the northern banks of the North Saskatchewan River. It is 14 km south of the town of Smoky Lake (12U 403657.15mE 5983770.47mN) and is located in the boreal forest dry mixed wood natural region.

Figure 3. Study area of the project
|
Field Site Selection
Métis Crossing covers an area of 300 hectares, so it is impractical to take a complete census of the site, therefore the area was divided into several zones (Figure 4) for sampling according to current land use. Considering current land use planning and random sampling strategy, we identified 2 grassland, 4 cropland, 4 aspen parkland, and 2 natural boreal forest (Figure 3) to cover all ecosystem types in Métis Crossing.

Figure 4. Land use planning at Métis Crossing
Forest Protocols
Each plot was set up as a 50 m transect along a north-south bearing. Tree and shrub density were measured by recording all stems that fell within a 1 m * 50 m belt transect. For ground cover survey, we used a combination of a 1 m2 circular ground layer quadrat and a 50 m transect to get a better estimate of the abundance and minimum scale diversity of the ground layer. Starting from 2.5 m, 1 m2 circular quadrats were systematically placed along the transect every 10 m, with a total of 5 quadrats. For each quadrat, each plant species was recorded, and percent cover was estimated using the visual-estimate method (Bråkenhielm & Qinghong 1995). With visual-estimate method, the species covers were estimated directly in percentage.
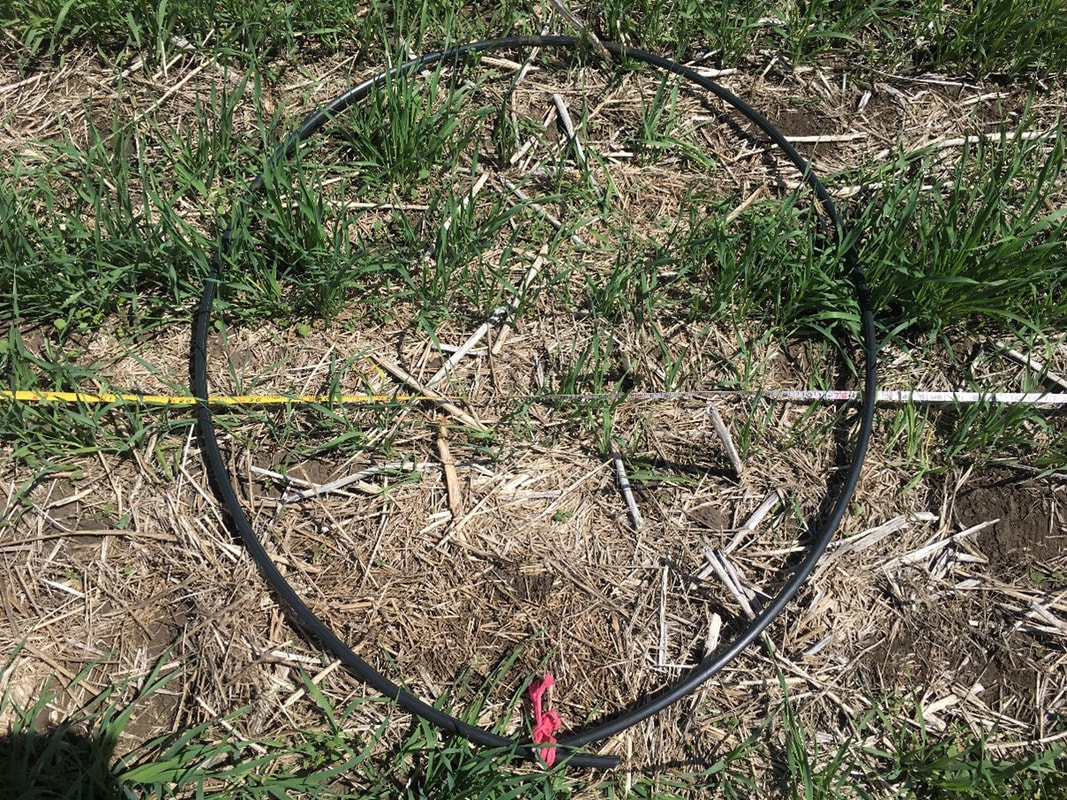
Figure 5. A 1 m2 circular quadrat in a cropland plot
|
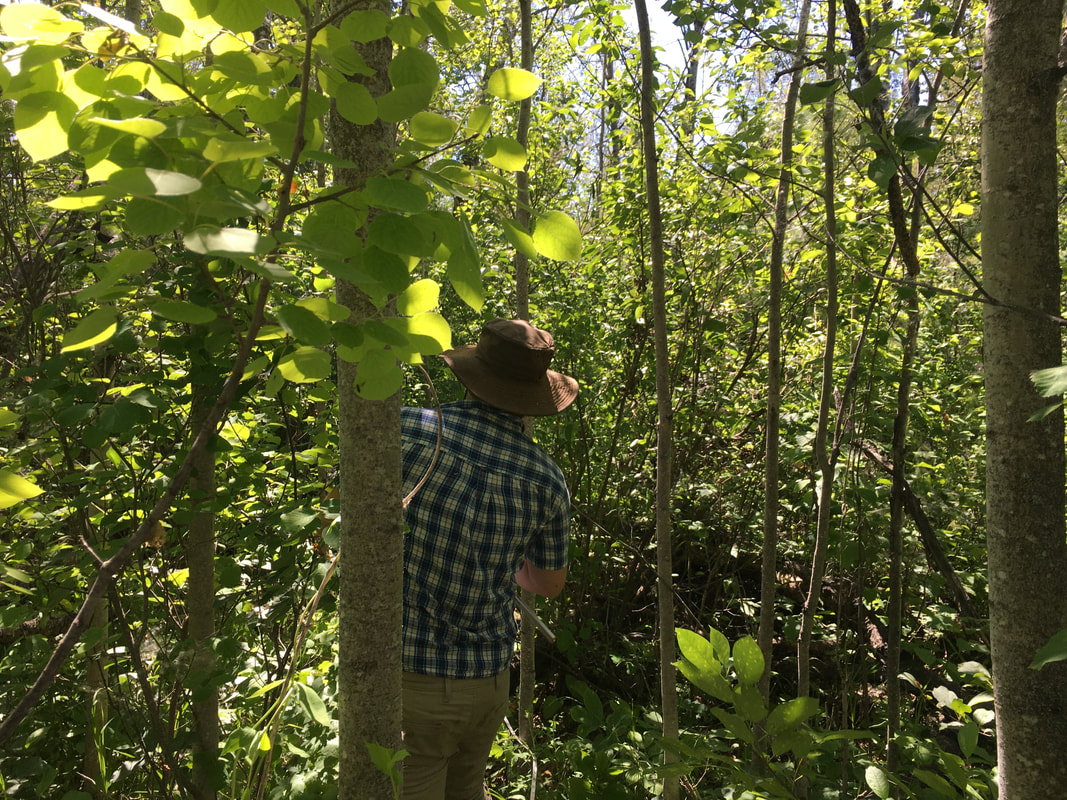
Figure 6. Measuring tree and shrub density in a natural forest plot
|
Species-area Overlap
The species-area overlap we created is a transformation of species–area curve, which describes the relationship between the sites, and the number of species found within that site. Larger and more sites tend to contain larger numbers of species, and empirically, the relative numbers seem to follow systematic mathematical relationships. The function of ggplot() was used in R to graph each point of species area overlap graph, and nls() was used to fit the non-linear model.
Diversity Index
To examine the plant biodiversity between ecosystems of Métis Crossing, four indexes were used. They were Species Richness, Simpson’s Diversity Index (Simpson 1949), Shannon Diversity Index (Shannon 1948), and Hill’s Number (Hill 1973). Species Richness is the simplest of all the measures of species diversity, it is the number of different species represented in an ecological community, landscape or region (Colwell 2009). Simpson's Diversity Index is a widely used dominance index (Xu et al. 2011), which is weighted toward the abundance of the commonest species and takes into account both richness and evenness. This index represents the probability that two individuals randomly selected from a community will belong to different species (Somerfield et al. 2008). Shannon Diversity Index is a significant information-statistic index, which takes into account rare species in a community, and quantifies the uncertainty associated with the prediction (Ibáñez & Alba 2000). In most ecological applications, Shannon entropy can be interpreted as a measure of the uncertainty in the species identity of an individual randomly selected from a community (Chao & Wang 2013). Sometimes the species diversity calculated by traditional methods is small and cannot really indicate the real situation. Hill's approach uses the number of equivalence to make the result more intuitive and clear. The number of equivalence means the number of species expected in a community with the same level of diversity but with equal abundance frequencies.
